Sidebar
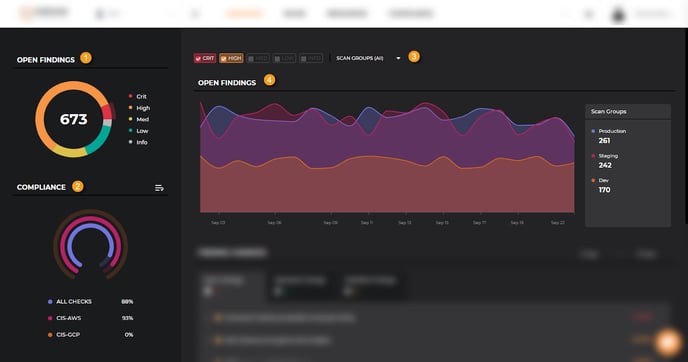
1. Open Findings
The Open Findings donut chart shows the total of all the open findings by severity level.
2. Compliance Graph
The Compliance graph shows your overall compliance posture for three compliance standards at a time.
It also allows you to choose which compliance standards you would like to see (see How to Change Compliance Graph Filters below)
Dashboard Body
3. Filters
Filters allow you to only show the findings relevant to the criteria you select. You can filter the content on the dashboard based on:
- Severity
- Scan Groups
Note: The filters are not global and only affect the right side of the Dashboard.
4. Open Findings
The Open Findings graph shows the trend of the number of findings for each scan group over time.
Finding Changes
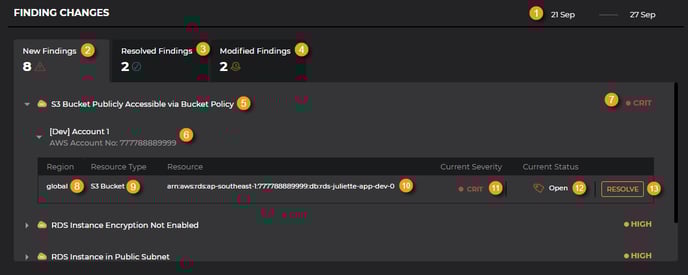
1. Date Picker
The date picker allows you to select the date range for the data you want to see. You can filter checks by week (default) or by month. 
2. New Findings
Failed checks (including those previously suppressed) that
- Have not appeared before
- Or previously passed but have now failed.
3. Resolved Findings
Checks which have been fixed that
- Either failed before and now passed
- Or whose resource context it was referencing is missing
4. Modified Findings
Failed findings whose severity level got changed, or whose status got suppressed through Vulnerability Management
5. Rule Title
The Warden rule being checked.
6. Cloud Account
The Cloud Account being checked on
7. Default Severity
The default severity of the Warden rule.
8. Region
The region a resource belongs to.
9. Resource Type
The type of resource.
10. Resource
The resource ID of the resource being checked on.
11. Current Severity
The check’s current severity level (for New and Resolved findings) and the change in severity for a time frame (for Modified findings).
12. Current Status
The current status of a check:
- New Findings and Resolved Findings
- Pass: Checks that passed
- Open: Failed checks that have not been triaged yet through Vulnerability Management
- Risk Accepted, False Positive, or Remediated: See Status Descriptions for more information.
- Modified Findings: the change in status for a check during a timeframe
13. Resolve
The Resolve button shows the details for a failed check.
How to Change Compliance Graph Filters
To change the compliance standards the Compliance graph shows:
- Click on the Filter (
 ) icon.
 - Check the compliance standards you want to show on the graph.
Note: You can select up to three standards to show on the graph at any one time.